
Flooding, Lake Lag, California Water situation - Printable Version
+- The CardBoard (https://thecardboard.org/board)
+-- Forum: C-House! (https://thecardboard.org/board/forum-4.html)
+--- Forum: The CardBoard (https://thecardboard.org/board/forum-5.html)
+--- Thread: Flooding, Lake Lag, California Water situation (/thread-23926.html)
+- The CardBoard (https://thecardboard.org/board)
+-- Forum: C-House! (https://thecardboard.org/board/forum-4.html)
+--- Forum: The CardBoard (https://thecardboard.org/board/forum-5.html)
+--- Thread: Flooding, Lake Lag, California Water situation (/thread-23926.html)
RE: Flooding, Lake Lag, California Water situation - dabigv13 - 08-14-2026
I thought Iniki hit the Big Island back in 1992 but maybe the eye didn't make landfall?
Jurassic Park was being filmed in Kauai at the time. The brief scene of big waves crashing on the shore during the fictional storm in the movie was filmed near the hotel where the cast and crew were staying, before they had to lockdown in the basement for the storm.
RE: Flooding, Lake Lag, California Water situation - Mick - 08-15-2026
Iniki did make landfall in 1992, last hurricane to make landfall on the Hawaiian archipelago. Supposedly, a hurricane hasn't hit the big island since 1871. Maui, Molokai and Kahoolawe are under tropical storm warning.
Hawaii under state of emergency ahead of historic hurricane
NWS says 69% chance of worst el Nino since 1950.
California Braces For Potentially Historic El Nino
RE: Flooding, Lake Lag, California Water situation - Mick - 08-17-2026
The Colorado River basin is under severe duress. Lake Mead and Lake Powell are coming perilously close to the point where they will no longer be able to generate electricity.
'Uncharted territory': Second-largest reservoir in US plunges to a record low
RE: Flooding, Lake Lag, California Water situation - BobK - 08-17-2026
So many depending on the Colorado River and the Reservoirs.
RE: Flooding, Lake Lag, California Water situation - fullmetal - 08-17-2026
The social media footage of Lala's effects on the Hawai'ian islands is intense. Large downed trees, torrents of muddy water, and washed out roads...spare a thought for those affected.
RE: Flooding, Lake Lag, California Water situation - Mick - 08-19-2026
Lala update:
Hurricane Lala explodes into major hurricane, triggers warnings for Northwestern Hawaiian Islands
RE: Flooding, Lake Lag, California Water situation - fullmetal - 08-19-2026
Holy smokes. The oceans are warming.
RE: Flooding, Lake Lag, California Water situation - Mick - 09-06-2026
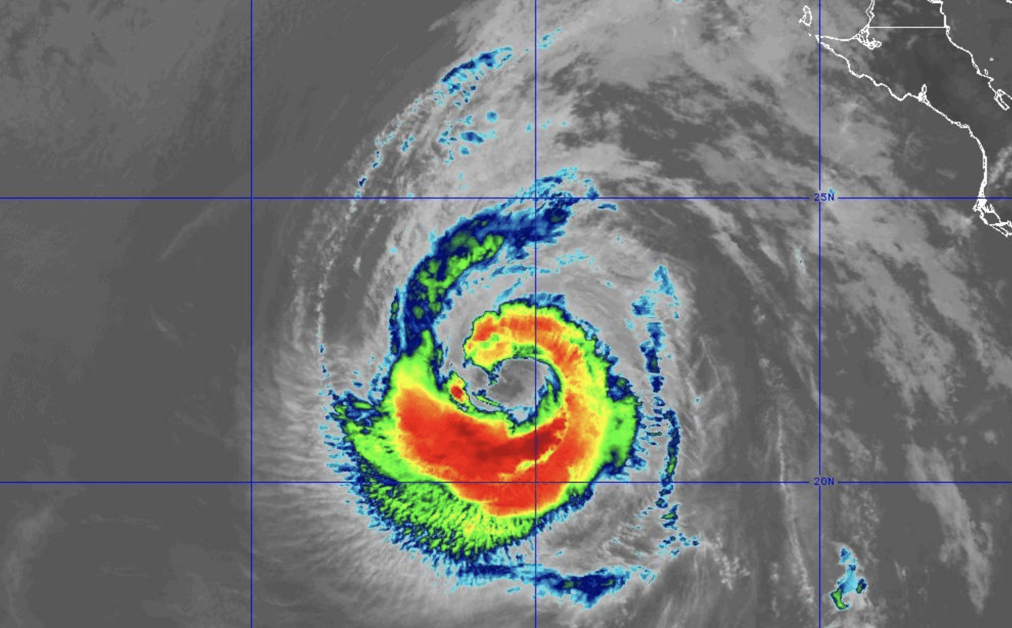
Hurricane Marie hits Southern California.
Hurricane Marie brings dangerous surf to Southern California
RE: Flooding, Lake Lag, California Water situation - cardcrimson - 09-06-2026
Things to worry about. Next up, Kelvin Waves. Who knew?
https://www.youtube.com/watch?v=qG9bVLfD58k
RE: Flooding, Lake Lag, California Water situation - M T - 09-06-2026
(09-06-2026, 10:30 AM)cardcrimson Wrote: Things to worry about. Next up, Kelvin Waves. Who knew?
https://www.youtube.com/watch?v=qG9bVLfD58k
A visualization of the Kelvin wave development from March to May 2026
https://www.jpl.nasa.gov/news/nasa-european-sea-level-mission-homes-in-on-el-nino/
Do note that Kelvin waves have troughs. Popular media only talks about the crests.
RE: Flooding, Lake Lag, California Water situation - Mick - 09-22-2026
Hurricane Polo is forming in the Pacific, will hit Southwestern Mexico, maybe a little extra flooding in SoCal. Shouldn't touch NorCal.
Hurricane Polo intensifies off Mexico, could mean a continued beating for SoCal coast - Los Angeles Times
What strengthening Cat-5 Hurricane Polo means for Southern California
National Hurricane Center says it will hit Mexico, doesn't mention SoCal:
nhc.noaa.gov/graphics_ep2.shtml?rainqpf

Year to date precipitation levels:
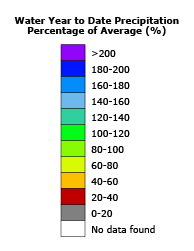
California Water Watch
RE: Flooding, Lake Lag, California Water situation - Mick - 09-29-2026
(09-06-2026, 11:09 AM)M T Wrote:(09-06-2026, 10:30 AM)cardcrimson Wrote: Things to worry about. Next up, Kelvin Waves. Who knew?
https://www.youtube.com/watch?v=qG9bVLfD58k
A visualization of the Kelvin wave development from March to May 2026
https://www.jpl.nasa.gov/news/nasa-european-sea-level-mission-homes-in-on-el-nino/
Do note that Kelvin waves have troughs. Popular media only talks about the crests.
Kelvin wave could raise the Pacific water level by up to a foot. This year’s El Niño is likely to be the largest in at least 1,000 years. Climate readings have already surged past the highest temperature ever recorded for the phenomenon several months before it is expected to peak.
Concern mounts over slow-moving, planetary-scale ‘Kelvin’ wave heading for California | California | The Guardian
RE: Flooding, Lake Lag, California Water situation - BostonCard - 09-30-2026
Meantime, across the Pacific, it has rained for 34 consecutive days on Tokyo, and it’s not even the typical rainy season (thats usually June), a new record…
https://phys.org/news/2026-09-tokyo-longest-streak-rainy-days.html
BC
RE: Flooding, Lake Lag, California Water situation - Mick - 10-03-2026
More on the Kelvin wave...
Sea levels to rise in California as coastal wave surges up west coast
El Niño causes ocean phenomenon waves to raise California sea levels
And for something a little more highbrow, the NASA/JPL take on El Nino and the Kelvin waves:
El Niño Is Underway - NASA Science
The last significant Kelvin waves to affect California were in 1997.
RE: Flooding, Lake Lag, California Water situation - M T - 10-06-2026
In regard to the use of groundwater, you may be interested in a report that primarily compares water rates across the US.
IMO, this study is flawed in multiple ways: (1) it doesn't include all the water systems (for instance, it doesn't include any of the SF Peninsula between the middle of Sunnyvale to San Francisco except San Mateo) (2) many of their numbers count water districts rather than customers served (areas of smaller districts dominate the stats, IMO) (3) I didn't see anything relating cost to average rainfall (4) the data include the same company name many times without indicating the location of the water district (other than the state it was in).
But, given the issues, some of its conclusions include
(1) "Surface water was often more expensive: All but one of the 25 most expensive systems relied on surface water, including seven systems that primarily purchased their surface water from other systems..."
(2) "Corporate systems were overrepresented: While only 11% of the 500 systems in the dataset were privately owned, 44% of the top 25 most expensive systems and 70% of the top 10 were owned by for-profit corporations."
(3) "California was overrepresented: More than half (52%) of the 25 most expensive systems were in California, whereas California systems represented just 18% of the 500 systems in the dataset. "
(4) "Water bills were unaffordable for low-income households in nearly all (93%) of the analyzed water systems."
(5) "Household drinking water bills rose 62% over the last decade... The 25 most expensive systems increased bills by an average of $637 in the past decade, a 124% rate hike. The 25 least expensive systems increased bills by $58, or 44%."
The rates for water ranged by a factor of 10 ($133/yr to $1416/yr(San Jose Water))
I believe the ability to use ground water is a consequence to being in an area whose rainfall is high relative to the water use. Generally water use is related to population, but farming in water-deficient areas (Calif. Central Valley) increases water use.
RE: Flooding, Lake Lag, California Water situation - Leftcoast - 10-06-2026
Regarding analysis below - Any speculation on WHY San Jose Water is so expensive? At one time they were a highly regarded example of a municipally owned utility doing it right - IE Keeping rates low and servicing customers first. Yet your sourced data shows that they are now cited as having the nationally HIGHEST cost for water.
Yikes-That's MY water company.
(10-06-2026, 12:44 PM)M T Wrote: In regard to the use of groundwater, you may be interested in a report that primarily compares water rates across the US.
IMO, this study is flawed in multiple ways: (1) it doesn't include all the water systems (for instance, it doesn't include any of the SF Peninsula between the middle of Sunnyvale to San Francisco except San Mateo) (2) many of their numbers count water districts rather than customers served (areas of smaller districts dominate the stats, IMO) (3) I didn't see anything relating cost to average rainfall (4) the data include the same company name many times without indicating the location of the water district (other than the state it was in).
But, given the issues, some of its conclusions include
(1) "Surface water was often more expensive: All but one of the 25 most expensive systems relied on surface water, including seven systems that primarily purchased their surface water from other systems..."
(2) "Corporate systems were overrepresented: While only 11% of the 500 systems in the dataset were privately owned, 44% of the top 25 most expensive systems and 70% of the top 10 were owned by for-profit corporations."
(3) "California was overrepresented: More than half (52%) of the 25 most expensive systems were in California, whereas California systems represented just 18% of the 500 systems in the dataset. "
(4) "Water bills were unaffordable for low-income households in nearly all (93%) of the analyzed water systems."
(5) "Household drinking water bills rose 62% over the last decade... The 25 most expensive systems increased bills by an average of $637 in the past decade, a 124% rate hike. The 25 least expensive systems increased bills by $58, or 44%."
The rates for water ranged by a factor of 10 ($133/yr to $1416/yr(San Jose Water))
I believe the ability to use ground water is a consequence to being in an area whose rainfall is high relative to the water use. Generally water use is related to population, but farming in water-deficient areas (Calif. Central Valley) increases water use.
RE: Flooding, Lake Lag, California Water situation - cardcrimson - 10-06-2026
Hopefully not delving into political issues, but San Jose has nothing on EBMUD. Seven years ago, I turned off my sprinklers, as it was at least $600 a month to run them. Only $200 a month when my wife and daughter are both here and no sprinklers. Tuscaloosa, I think is about $50, with sprinklers. . . .
Several years ago during the last drought, EBMUD asked for a rate increase to discourage water usage. It was granted. That winter we got a ton of rain and the reservoirs filled. EBMUD, because users had cut back water usage so much, asked for an increase in rates to make up for the lost revenue. It was granted. . . .
RE: Flooding, Lake Lag, California Water situation - M T - 10-07-2026
(10-06-2026, 05:09 PM)cardcrimson Wrote: Hopefully not delving into political issues, but San Jose has nothing on EBMUD. Seven years ago, I turned off my sprinklers, as it was at least $600 a month to run them. Only $200 a month when my wife and daughter are both here and no sprinklers. Tuscaloosa, I think is about $50, with sprinklers. . . .
Several years ago during the last drought, EBMUD asked for a rate increase to discourage water usage. It was granted. That winter we got a ton of rain and the reservoirs filled. EBMUD, because users had cut back water usage so much, asked for an increase in rates to make up for the lost revenue. It was granted. . . .
The report shows EBMUD at #30 in their list, serving 1.44M people, costing $955 per year for 60,000 gallons. (Please see the report for details of how they computed the cost. Note this is just for water. (Sewage, etc, is not included.)) So San Jose Water Co. is about 50% higher. I have no further info as to how the rates are set.
Btw, I see that the a new estimate of rain has just been published, (for instance) upping the rain in SF in January by 25% versus the prediction made last month. SFChronicle:
"From December through March, the model’s average forecast runs at nearly double its normal rainfall in San Francisco and San Jose, and at more than two and a half times normal in San Diego."
Forecast for December-March for SF/Oakland: 26.0" for SJ: 28.4"
"This is based on an average of 51 model forecasts from the ECMWF SEAS5 seasonal forecast, Oct. 1, 2026 run. "Typical" is the model's 1993-2016 average at each location, not the local rain gauge's record."
That's a strange definition of "typical". I was wondering where this "SF/Oakland" gauge would be located. I believe that for "San Jose", the rain varies greatly by neighborhood.
Their data is based on the API at https://open-meteo.com/en/docs/seasonal-forecast-api
You can run it for wherever you want and for whatever time frame you want.
Hint: Just do the month measurements if you do Dec. through March.
Weekly didn't produce anything.
RE: Flooding, Lake Lag, California Water situation - Mick - 10-13-2026
Might could maybe be an all-time temperature high as a result of this El Nino. Some pockets of the ocean are already experiencing that phenomenon. The Copernicus Climate Change Service said sea surface temperatures in a tell-tale El Nino monitoring region of the Pacific, known as Nino3.4, had reached an "all-time high" of 29.70C last month. This exceeded the peak temperatures of previously strong El Nino events of 1982/1983, 1997/1998 and 2015/2016.
Super El Nino could make 2026 record hottest year: climate monitor
Waves are devastating Long Beach:
'Devastating' waves leave California beach homes on brink of collapse
RE: Flooding, Lake Lag, California Water situation - jacket3ree - 10-13-2026
I know some people at SJWC. We may have sent them a bill or three for work. San Jose Water is regulated by the California Public Utilities Commission, which does review their rate structures. Reasons that the rates are high could be:
Fixed costs spread over smaller water use due to conservation measures.
Pass through of Valley Water's wholesale rates. Gotta pay for Anderson Dam Seismic Retrofit and jacketree's ridiculous billing rates!
Aging system and massive investments in upgrading the infrastructure. Thank them later when nothing blows, so there is no massive sinkhole that swallows one of your nice cars.
Maybe the investors are greedy and the CPUC caved?
It's California. Everything costs more. Labor, healthcare, union stuff, utility mandates. Everything.